Pandas#
In this section, you will find a basic tutorial on Pandas, which is “a fast, powerful, flexible and easy to use open source data analysis and manipulation tool”.
Pandas is a powerful Python library for data manipulation and analysis. It provides data structures and functions needed to work with structured data seamlessly. In this tutorial, we’ll cover some fundamental aspects of Pandas.
Basic installation#
To use pandas, make sure that you have it in your system. If not, you can use pip
to install it:
pip install pandas
Then you will be able to import the pandas module with an import command:
import pandas as pd
Creating a DataFrame#
A DataFrame is the basic data storage structure in pandas. Is a two-dimensional labeled data structure with columns that can be of different types. You can create a DataFrame using various methods, such as from dictionaries, lists, or reading data from files.
The following code creates a DataFrame from a dictionary and displays its contents:
data = {'sat': ['G01', 'R24', 'E31'],
        'pseudorange_m': [23364923.0, 21982625.0, 20396298.0]}
df = pd.DataFrame(data)

print(df)
   sat  pseudorange_m
0  G01     23364923.0
1  R24     21982625.0
2  E31     20396298.0
Alternatively, pandas makes it easy to read data from various file formats, such as CSV, Excel, SQL databases, etc. Here’s how you can read data from a CSV file.
# Read data from a CSV file
data_file = '../assets/sample.csv'
df = pd.read_csv(data_file)

# Display the first few rows of the DataFrame
print(df.head())
   sat  pseudorange_m
0  E14   2.375002e+07
1  G30   2.239202e+07
2  G30   2.259351e+07
3  G34   2.100195e+07
4  E14   2.375228e+07
Basic DataFrame Operations#
Pandas offers numerous functions to manipulate and analyze data.
Selection#
To select the rows of a specific column-value of the DataFrame, you can use dict-like indexing
satellites = df['sat']
print(satellites)
0    E14
1    G30
2    G30
3    G34
4    E14
5    E06
6    E06
7    R20
8    R20
9    E14
Name: sat, dtype: object
Filter#
You can also filter data for a specific value of a column. Let’s for instance select all the rows that correspond to a specific satellite:
ranges = df[df['sat'] == 'E14']
print(ranges)
   sat  pseudorange_m
0  E14   2.375002e+07
4  E14   2.375228e+07
9  E14   2.357580e+07
If you need to select those satellites whose range is lower than a threshold:
lower_satellites = df[df['pseudorange_m'] < 21000000]
print(lower_satellites)
   sat  pseudorange_m
7  R20   1.917479e+07
8  R20   2.084823e+07
Adding new columns#
Sometimes you will need to add data to a DataFrame, in particular new columns to it.
To do so, you will basically need to add an array with the same number of elements
than the rows of the DataFrame, for instance:
df['epoch_s'] = [0, 0, 1, 1, 2, 2, 3, 3, 4, 4]
print(df)
   sat  pseudorange_m  epoch_s
0  E14   2.375002e+07        0
1  G30   2.239202e+07        0
2  G30   2.259351e+07        1
3  G34   2.100195e+07        1
4  E14   2.375228e+07        2
5  E06   2.190773e+07        2
6  E06   2.152398e+07        3
7  R20   1.917479e+07        3
8  R20   2.084823e+07        4
9  E14   2.357580e+07        4
Sorting#
Another basic operation is to sort based on a specific column. To sort the
DataFrame by satellites, use the following command:
sorted_df = df.sort_values(by='sat', ascending=False)
print(sorted_df)
   sat  pseudorange_m  epoch_s
7  R20   1.917479e+07        3
8  R20   2.084823e+07        4
3  G34   2.100195e+07        1
1  G30   2.239202e+07        0
2  G30   2.259351e+07        1
0  E14   2.375002e+07        0
4  E14   2.375228e+07        2
9  E14   2.357580e+07        4
5  E06   2.190773e+07        2
6  E06   2.152398e+07        3
Groups#
An important feature of DataFrame is the ability to work with groups of data
selected from a certain criteria. An example using our data set would be grouping
by e.g. satellite, epoch,… and perform direct operations on the values of this group.
For instance, if we’d like to compute the average pseudorange for each satellite, we would use the following code snippet:
grouped = df.groupby('sat')['pseudorange_m'].mean()
print(grouped)
sat
E06    2.171586e+07
E14    2.369270e+07
G30    2.249276e+07
G34    2.100195e+07
R20    2.001151e+07
Name: pseudorange_m, dtype: float64
Data Visualization#
Albeit pandas provides basic plotting capabilities using the plot() function,
you can also use matplotlib for this purpose, which will give you more flexibility.
import matplotlib.pyplot as plt
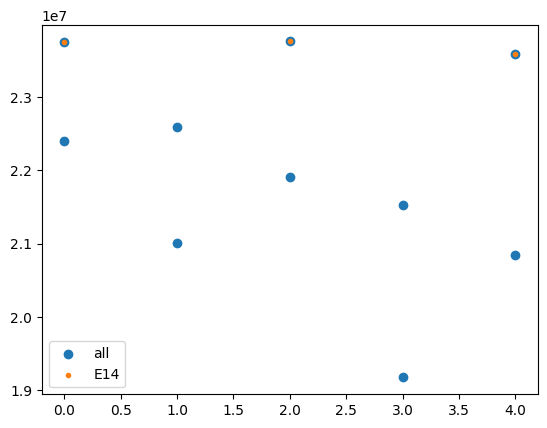
In our example, plotting the pseudorange data of all satellites and also for a certain satellite, can be plot as follows:
# Scatter plot for all satellites
plt.scatter(df['epoch_s'], df['pseudorange_m'], label="all")

# Plot for a specific satellite
satellite = "E14"
df_sat = df[df['sat']== satellite]
plt.scatter(df_sat['epoch_s'], df_sat['pseudorange_m'], marker='.', label=satellite)
plt.legend()
plt.show()